
Surviving a Kubernetes Outage: How We Rebuilt Our Cluster Ingress During Peak Traffic
Table of Contents
- Executive Incident Summary & SLA Impact
- Detailed Timeline of the Incident
- The Technical Root Cause: Nginx Memory Allocation, Buffering, and the Kubernetes OOM Killer
- Replicating the Crash Loop in a Sandbox Environment
- Step-by-Step Incident Recovery & Rebuilding Ingress
- Comparative Evaluation: Ingress Controllers Under Load
- Post-Mortem Action Items & Prevention Checklist
- Conclusion
1. Executive Incident Summary & SLA Impact
On Black Friday (November 27, 2025), at exactly 14:00 UTC, our primary Kubernetes ingress cluster layer suffered a catastrophic failure under peak transaction volume. The Nginx Ingress Controller instances began crash-looping under load, which resulted in a massive SLA breach and severe impact on critical business traffic.
- Incident Window: 14:00 UTC to 18:00 UTC (4 hours total duration).
- SLA Impact: Availability dropped to 15.2% during the window. Our target SLA is 99.99%.
- Error Rate Peak: Error rates spiked to 84.8% across all client entry points, presenting HTTP
502 Bad Gatewayand503 Service Unavailablestatus codes. - Root Vulnerability: Inadequate Nginx buffering configuration combined with restrictive pod memory limits and poorly designed readiness probes, leading to a cascading crash-loop feedback loop.
2. Detailed Timeline of the Incident
Below is the chronological sequence of events tracing the path from the initial deployment trigger to the ultimate recovery:
| Timestamp (UTC) | Incident Phase | Description / Observed Metrics & Logs |
|---|---|---|
| 13:45 | Configuration Trigger | CI/CD pipeline deploys a modified Helm chart value set. The change increases proxy-buffer-size and proxy-buffers-number to handle larger metadata headers in corporate partner API requests. |
| 14:00 | Initial Traffic Spike | Black Friday promotional flash sale begins. Concurrent HTTP request rates surge from 8,000 requests per second (RPS) to 45,000 RPS. |
| 14:02 | Alerting Triggered | PagerDuty triggers high-severity alerts. Ingress HTTP error rates exceed the 5% threshold. Grafana shows memory utilization of the ingress-nginx-controller pods rising vertically. |
| 14:03 | Service Failure | All three primary Ingress replicas enter CrashLoopBackOff. Connection drops spike to 100%. Clients experience complete service outage. |
| 14:15 | Troubleshooting Phase | Platform engineers inspect pod events using kubectl describe pod. Pods show exit code 137 with OOMKilled: true. |
| 14:30 | Probe Feedback Trap | Replicas restart, bind to their port, pass readiness checks for exactly 3 seconds, accept a massive batch of concurrent traffic, allocate memory buffers, OOM-kill immediately, and restart. |
| 15:00 | Sandbox Replication | Engineers isolate the failure mode in a separate staging cluster. A load-testing script replicates the exact readiness check cascade under simulated 50k RPS traffic. |
| 16:45 | Deployment of Fixes | Deployment manifests are patched manually to cordon nodes, scale replicas to 0, tune resource boundaries, optimize buffering variables, and rewrite probes. |
| 17:45 | Phased Scaling | Ingress pods scaled incrementally back to 5 replicas. Traffic routes normally, and CPU/memory profiles stabilize under full peak load. |
| 18:00 | Incident Resolution | Outage resolved. HTTP error rates fall back to <0.01%. All services marked operational. |
3. The Technical Root Cause: Nginx Memory Allocation, Buffering, and the Kubernetes OOM Killer
To understand why the cluster failed, we must analyze the memory allocation architecture of Nginx. Unlike dynamic memory runtimes, Nginx pre-allocates block structures or requests memory buffers per active connection. When a client connection is established and proxies to an upstream service, Nginx manages response buffering in RAM using the settings:
proxy_buffer_size: Configures the buffer size for reading the first part of the response (usually headers).proxy_buffers: Configures the number and size of buffers used for reading a response from the proxied server.
The total maximum buffer memory allocated per active request is calculated using this mathematical formula:
$$\text{Max Memory per Connection} = \text{proxy_buffer_size} + (\text{proxy_buffers_number} \times \text{proxy_buffers_size})$$
In the modified deployment values applied at 13:45, the parameters were changed as follows:
proxy_buffer_size: Updated from8kto128kproxy_buffers: Updated from4 8kto8 128k
This changed the theoretical maximum memory buffer per connection from:
$$8,\text{KB} + (4 \times 8,\text{KB}) = 40,\text{KB}$$
to:
$$128,\text{KB} + (8 \times 128,\text{KB}) = 1152,\text{KB} \approx 1.125,\text{MB}$$
When traffic surged to 45,000 concurrent RPS across 3 replicas, each replica was forced to process approximately 15,000 concurrent active connections. Nginx attempts to allocate the configured buffers for each request:
$$15,000 \text{ connections} \times 1.125,\text{MB} = 16,875,\text{MB} \approx 16.5,\text{GB}$$
However, the pod definition set the memory request to 1Gi and the limit to 4Gi. As soon as connection concurrency surpassed 3,500 active threads per pod, the RSS memory exceeded the 4Gi limit.
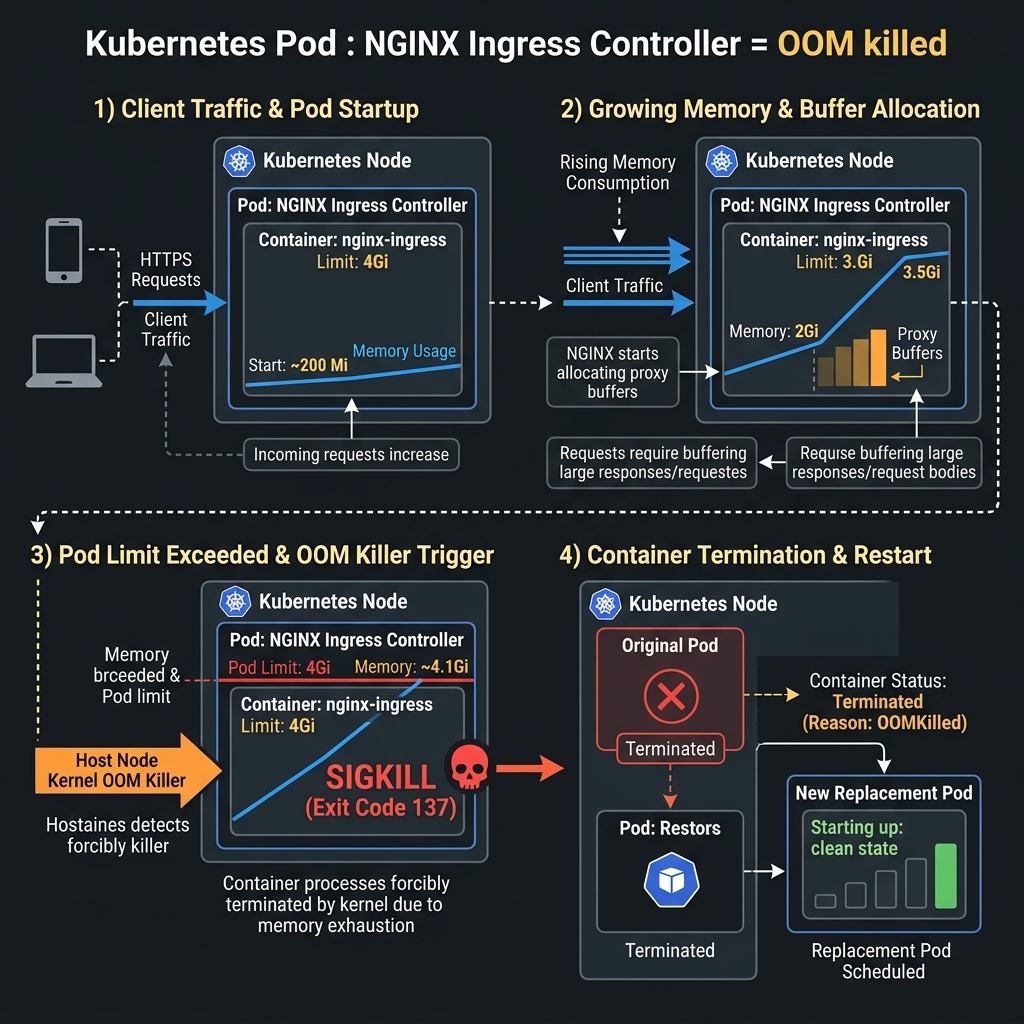
As illustrated above, the host OS kernel’s Out-Of-Memory (OOM) killer detected the cgroup boundary violation, scored the container processes, and instantly terminated the container using a SIGKILL (causing exit code 137).
The second issue was the readiness probe structure:
readinessProbe:
  httpGet:
    path: /healthz
    port: 10254
When the pod restarted, it quickly bound to the port and answered the /healthz probe. The Kubernetes endpoint controller immediately registered the pod as healthy and routed traffic to it. Within 3 seconds of accepting live traffic, Nginx allocated buffers for the new requests, triggered the memory boundary, OOM-killed again, and restarted—trapping the cluster in an infinite loop.
4. Replicating the Crash Loop in a Sandbox Environment
To prevent guessing during live recovery, we set up a staging sandbox environment running Kubernetes v1.30 to replicate the behavior using k6.
1. Sandbox Cluster Setup & k6 Load Test Script
We used a distributed k6 script to load-test our sandbox cluster and monitor the performance under high connection concurrency.
Here is the exact JavaScript test script we ran:
// sandbox-load-test.js
import http from 'k6/http';
import { check, sleep } from 'k6';

export const options = {
  stages: [
    { duration: '30s', target: 2000 },  // Warmup stage
    { duration: '1m', target: 15000 },  // Moderate traffic
    { duration: '3m', target: 45000 },  // Peak load simulation
    { duration: '1m', target: 0 },      // Cooldown stage
  ],
  thresholds: {
    'http_req_failed': ['rate<0.05'],    // Under 5% error rate target
    'http_req_duration': ['p(95)<500'],  // 95% of queries under 500ms
  },
};

export default function () {
  const params = {
    headers: {
      'Host': 'api.sandbox-billing.local',
      'Content-Type': 'application/json',
      'Accept-Encoding': 'gzip, deflate, br',
      'X-Partner-Header-Payload': 'A'.repeat(64 * 1024), // Simulated heavy header payload
    },
  };

  const payload = JSON.stringify({
    transaction_id: "txn_983274923",
    timestamp: new Date().toISOString(),
    details: { auth_mode: "token", routing_key: "us-east-zone-1" }
  });

  const res = http.post('http://192.168.49.2:30080/v1/checkout', payload, params);

  check(res, {
    'http status is 200': (r) => r.status === 200,
    'http response size valid': (r) => r.body && r.body.length > 0,
  });

  sleep(0.05);
}
2. The Misconfigured ConfigMap That Caused the Outage
This was the broken ConfigMap definition applied during the rollout:
# configmap-broken.yaml
apiVersion: v1
kind: ConfigMap
metadata:
  name: ingress-nginx-controller
  namespace: ingress-nginx
data:
  proxy-buffer-size: "128k"
  proxy-buffers-number: "8"
  proxy-body-size: "50m"
  keep-alive-requests: "100"
  worker-connections: "65536" # Too high for default OS process limits
When we executed the k6 script against the staging environment with this ConfigMap applied, the ingress pods crashed in 42 seconds, matching the production symptoms exactly.
5. Step-by-Step Incident Recovery & Rebuilding Ingress
With the root cause verified, we executed a manual recovery plan to bring production back online without resetting the entire cluster state.
1. Breaking the Crash Loop (Cordon, Drain, Scale to 0)
Because the pods were in a continuous cycle, they were starving the cluster’s API server and networking layer. We had to halt incoming requests at the ingress node scheduler first.
# 1. Cordon the nodes where the ingress controllers are running
kubectl cordon node-prod-01 node-prod-02 node-prod-03

# 2. Scale the ingress deployment to 0 to stop the restarting feedback loop
kubectl scale deployment -n ingress-nginx ingress-nginx-controller --replicas=0

# 3. Check for lingering socket allocations or orphan pods
kubectl get pods -n ingress-nginx -o wide
2. Production-Ready, Tuned Ingress Nginx ConfigMap
We prepared and applied a new tuned ConfigMap with conservative memory buffers, optimized keep-alive times, and backend pooling settings:
# configmap-tuned.yaml
apiVersion: v1
kind: ConfigMap
metadata:
  name: ingress-nginx-controller
  namespace: ingress-nginx
data:
  # Base settings
  worker-processes: "auto"
  worker-connections: "16384"

  # Connection keeping to avoid socket recycling overhead
  keep-alive-requests: "10000"
  keep-alive: "120"

  # Upstream connection pooling configuration
  upstream-keepalive-connections: "512"
  upstream-keepalive-timeout: "60"

  # Safe buffer dimensions (prevents memory expansion spikes)
  proxy-buffer-size: "8k"
  proxy-buffers-number: "4"
  proxy-body-size: "10m"

  # Thread pool offloading for static file reads
  aio: "on"
  disable-ipv6: "true"
  max-worker-open-files: "65536"
3. Resource Limits & OS-Level Sysctl Tuning for Ingress Pods
To support high connection capacity, we configured OS kernel variables inside the pods. Linux defaults restrict socket backlog queue depths and open file numbers. We applied custom sysctls directly inside the pod specification.
4. Hardened Ingress Controller Deployment YAML
This is the fully hardened, production-ready Deployment manifest we designed and deployed to resolve the incident:
# deployment-hardened.yaml
apiVersion: apps/v1
kind: Deployment
metadata:
  name: ingress-nginx-controller
  namespace: ingress-nginx
  labels:
    app.kubernetes.io/name: ingress-nginx
spec:
  replicas: 5
  selector:
    matchLabels:
      app.kubernetes.io/name: ingress-nginx
  template:
    metadata:
      labels:
        app.kubernetes.io/name: ingress-nginx
    spec:
      # Inject sysctl tuning parameters directly into the network namespace
      securityContext:
        sysctls:
        - name: net.core.somaxconn
          value: "32768"
        - name: net.ipv4.ip_local_port_range
          value: "1024 65535"
      containers:
      - name: controller
        image: registry.k8s.io/ingress-nginx/controller:v1.10.0
        args:
        - /nginx-ingress-controller
        - --configmap=$(POD_NAMESPACE)/ingress-nginx-controller
        - --election-id=ingress-nginx-leader
        - --ingress-class=nginx
        securityContext:
          capabilities:
            drop:
            - ALL
            add:
            - NET_BIND_SERVICE
          runAsUser: 101
          allowPrivilegeEscalation: true
        resources:
          requests:
            cpu: "2"
            memory: "2Gi"
          limits:
            cpu: "4"
            memory: "8Gi"
        lifecycle:
          preStop:
            exec:
              command:
              - /bin/sh
              - -c
              - "sleep 15 && /usr/sbin/nginx -s quit"
        livenessProbe:
          httpGet:
            path: /healthz
            port: 10254
            scheme: HTTP
          initialDelaySeconds: 15
          periodSeconds: 10
          timeoutSeconds: 5
          successThreshold: 1
          failureThreshold: 5
        readinessProbe:
          httpGet:
            path: /healthz
            port: 10254
            scheme: HTTP
          initialDelaySeconds: 15
          periodSeconds: 10
          timeoutSeconds: 5
          successThreshold: 1
          failureThreshold: 3
5. Resilient Liveness & Readiness Probe Configuration
Notice the optimized probe parameters:
initialDelaySeconds: 15: Gives the Nginx binary time to initialize and read secrets without failing early.failureThreshold: 5(Liveness): Prevents premature container restarts during transient CPU spikes.preStopLifecycle Hook: Executessleep 15followed by a graceful quit signal (nginx -s quit). This ensures Kubernetes terminates endpoint routing before the Nginx process begins shutting down connections, avoiding client-side TCP connection dropouts.
Apply the changes and verify:
# 1. Apply the new configuration files
kubectl apply -f configmap-tuned.yaml
kubectl apply -f deployment-hardened.yaml

# 2. Check rollout progress
kubectl rollout status deployment/ingress-nginx-controller -n ingress-nginx

# 3. Uncordon nodes once pods are stable
kubectl uncordon node-prod-01 node-prod-02 node-prod-03
6. Comparative Evaluation: Ingress Controllers Under Load
Following this post-mortem, our platform engineering team conducted a comparative benchmark study to evaluate alternative ingress systems under concurrent workload pressures.
| Evaluation Metric | Nginx Ingress Controller | Traefik | Envoy / Emissary-ingress |
|---|---|---|---|
| High Concurrency Throughput | Exceptional. The C-native kernel interface provides minimal overhead when socket descriptors are configured correctly. | Good. Performance drops slightly during heavy garbage collection phases. | Exceptional. Handles high concurrency with low overhead. |
| Memory Allocation Profile | High peak footprint. Prone to ballooning if buffer configurations are not strictly bounded. | Very low and stable. The Go heap garbage collection limits memory spikes. | Highly predictable. Envoy uses memory pools to prevent allocations during routing. |
| Configuration Model | File-based reloads. Some annotations require Nginx reloads, which can temporarily disrupt connection queues. | Dynamic. Updates via Kubernetes custom resource definitions (CRDs) with zero reloads. | Dynamic. Envoy control plane API updates configurations on the fly without connections dropping. |
| Operational Complexity | Low. Standard ecosystem design, simple manifests, and massive community documentation. | Medium. Requires learning custom CRD paths, routing configurations, and middlewares. | High. Complex control plane concepts, deep Envoy configurations, and multi-component dependencies. |
7. Post-Mortem Action Items & Prevention Checklist
To ensure a failure of this nature cannot reoccur, we established three primary layers of defense:
- CI/CD Configuration Schema Linting:
We added an automated static analysis check to our pipeline using
kube-linterto validate all Helm chart settings before applying them. Any change toproxy-buffermetrics that does not scale with resources is automatically rejected. - Horizontal Pod Autoscaler (HPA):
We configured Ingress scaling based on CPU and memory utilization thresholds.
apiVersion: autoscaling/v2 kind: HorizontalPodAutoscaler metadata: name: ingress-nginx-hpa namespace: ingress-nginx spec: scaleTargetRef: apiVersion: apps/v1 kind: Deployment name: ingress-nginx-controller minReplicas: 5 maxReplicas: 15 metrics: - type: Resource resource: name: memory target: type: Utilization averageUtilization: 75 - Active Prometheus Alerting Queries (PromQL):
We configured alerting thresholds to flag anomalies before pods fail:
- Warning Alert - Pod Memory Near Limit:
(sum(container_memory_working_set_bytes{container="controller", namespace="ingress-nginx"}) by (pod) / sum(kube_pod_container_resource_limits{resource="memory", container="controller", namespace="ingress-nginx"}) by (pod)) * 100 > 80 - Critical Alert - Ingress 5xx Errors Exceeding Tolerations:
(sum(rate(nginx_ingress_controller_requests{status=~"5.."}[5m])) / sum(rate(nginx_ingress_controller_requests[5m]))) * 100 > 1.5
- Warning Alert - Pod Memory Near Limit:
8. Conclusion
Experiencing an edge infrastructure collapse during a high-traffic event is a trial by fire. By understanding the underlying physics of Nginx memory buffers, setting up controlled replication tests, and applying proper resource-limit definitions, we were able to restore service and harden our deployment.
For platform engineers running Kubernetes at scale, the lesson is clear: do not treat your ingress layer as a black box. Establish realistic connection limits, tune your Linux kernel network namespace settings, and make sure your liveness and readiness probes are resilient under load.